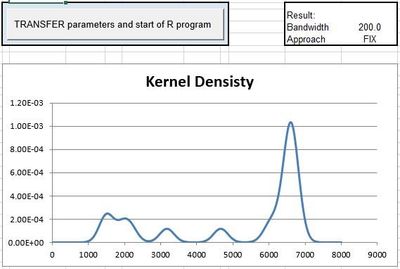
Simple interface R - Excel
When developing ACOMED statistics for external customers, customers wanted to be able to carry out complex statistical analyzes themselves. This is possible with the open source software R. However, it is necessary for users to be able to program in R. The data input and output as well as the graphical representation in R is not as easy to implement as in MS Excel.
For this reason, ACOMED statistics 2009 developed a simple interface in the sense of a principle solution, which is adapted to the respective requirements of the customers. Since external statisticians expressed interest, it should be made available for download here. We are now using a more modern version (see commented script in VBA code), the function of which has not been investigated under Excel 2016 and later.
I thank S. Weber and M. Harteis, interns at ACOMED statistics at the time, for the creation.
functionality
Data and parameters of the analysis are entered in Excel. The following steps are implemented in the VBA program:
- Storage of data and parameters in transfer files start from R,
- automatic transfer of the names of the transfer files.
- Wait for the R calculation, load the result files provided by R.
- Results and graphics are available to the user in Excel format in the usual way.
Preparatory steps
- Programming of the complex analysis in R by statisticians
- In the directory in which the Excel file is saved, there should be 3 subdirectories: prog (R-script), parameters_and_data (transfer files Excel to R), results (result file (s) R to Excel)
- Provision of the program name in Excel spreadsheet
- Providing the path for RSript.exe in Excel spreadsheet
- Adaptation of file names for transfer
- if necessary, adaptation of the transfer procedure in MS Excel
Execution steps
- Enter the data
- Entry of specific parameters of the analysis
- Start the analysis
- ... and wait if analysis in R is complex (e.g. bootstrapping)


